Blog

Visualize your Company’s Performance with Power BI
Does your company have invaluable data across multifarious applications, but isn’t using it to its full potential? What if you could capture metrics of that data within visualizations in one central location to ascertain your company’s performance? As I pointed out in a previous blog, Microsoft’s Power BI offers an attractive feature for creating dashboards with interactive visualizations from multiple data sources.
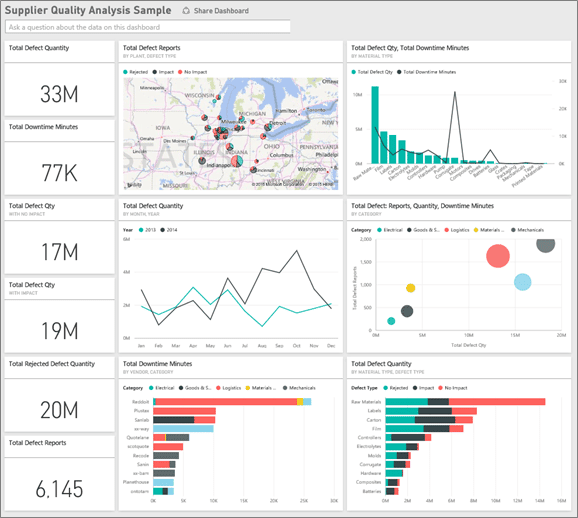
Taken from their listed sample datasets, here is an example of what a dashboard can look like:
 obviEnce ©
Power BI offers many ways of connecting to data, whether your data is hosted on premise, in the cloud or on a third party website. In this blog, I will provide an overview of retrieving data in order to create powerful visualizations for your team.
Before working with Power BI, you want to first ask yourself a couple of questions:
- What data do I want to work with? Perhaps you want to work with your Accounts, Opportunities, Invoices or custom components created by your admin or partner.
- Where is the data located? Perhaps it’s on your organizations hosted database, in the cloud such as on the MS Dynamics CRM platform or perhaps it’s in multiple locations!
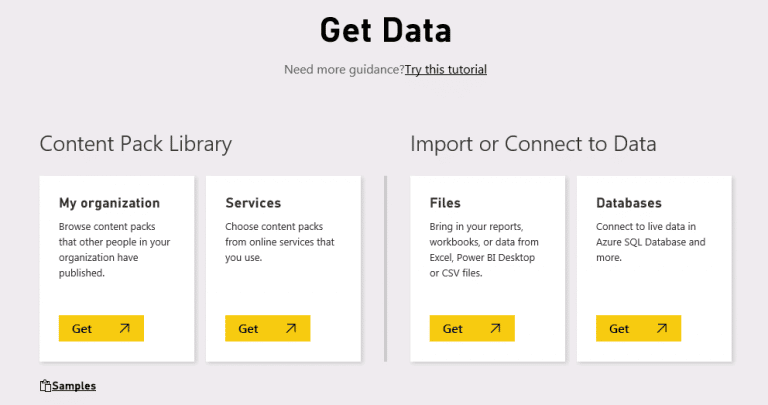
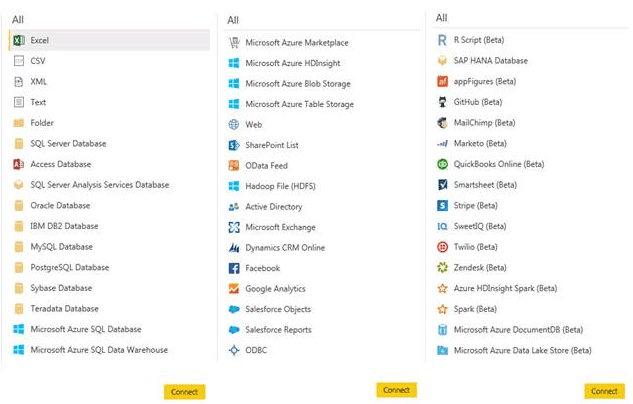
When you first log into the web version of the Power BI service, you can choose to Get Data. This screenshot shows an overview of the options you can choose from [Later in this blog you will see that you have a host of other options to choose from with the Power BI Desktop]
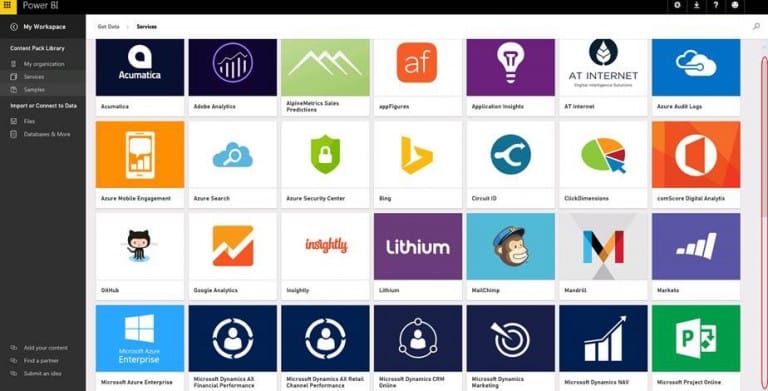
For online data sources, Power BI hosts a few pre-built content packs that might be useful to you. Content packs contain pre-selected data fields you can choose from. They can also contain a few pre-built reports and dashboards, but you can create your own.
In the above screenshot, if you selected the “Get” under services, you can see what they currently have. Keep in mind that this list may expand, so what you see today may change:
One limitation of using pre-built content packs is that you can’t customize the datasets. If you need data fields that aren’t included in it, you might not find much use for it. [Later in this blog you will read that you can create your own content packs with the Power BI Desktop]
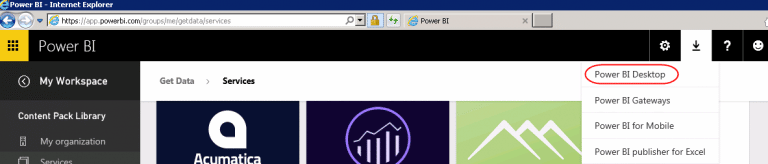
For most situations, you’re probably going to want to create and customize your own datasets. For this, we recommend that you install the Power BI Desktop from the online service:
It’s an easy install and it will give you more options in terms of choosing a data source and functions that can be used to create your reports. If you are working with a significant amount of data or may have multiple admins in control of your Power BI solutions, we recommend that you install this on one of your local servers or a dedicated VM for Power BI. It doesn’t need to be a workhorse or even on the same server as your data source, but you may find it easier to work with if it is on the same local network.
Once you have the Power BI Desktop installed, you can begin connecting to your different data sources. You can see from this list that you have several options to choose from currently, but this is expanding!:
I want to point out that before you connect to an on premise source, such as a SQL database, you will need to set up a secure channel between the Power BI service for scheduling data refreshes. For this, you will need a Windows Administrator to install a gateway locally for you. There are two to choose from and both are easy installs. They can be on the same server that you installed the Power BI Desktop.
Each gateway has its benefits & limitations, so take some time to learn about them. It’s important to choose the appropriate gateway before creating your report as it will determine the method of data retrieval and once chosen, you cannot change it.
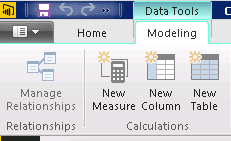
Once you have connected to the data, you can use the Power BI Desktop interface to shape data and model the data by creating measures, calculated columns or new tables using built in DAX functions
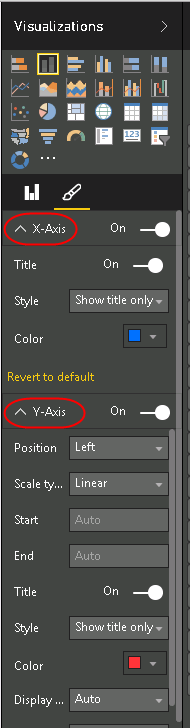
Once you have the data the way you like it, you can start creating your report with various visualizations to choose from. You also have freedom to change labels and colors as needed:
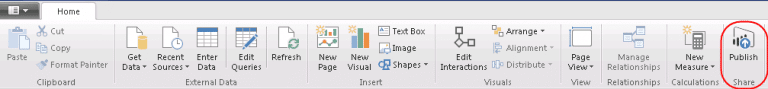
Once you’re satisfied with the reports, you can publish them to the Power BI cloud service:
You can then add your reports to a content pack for your team members to personalize, or add the reports to a new or existing dashboard and share with users.
With Power BI giving you the ability to connect to multiple data sources, you can create some pretty powerful visualizations that your executives can use for performance viewing across the entire company. Stay tuned as I dive into further areas within this exciting service.
Beringer Associates is always here to provide expert knowledge in topics like these. Please contact us with any questions you may have.
[code-snippet name=”blog”]
Recent Posts


How can we help?
Whether you're seeking a fully managed IT solution or expert assistance with a Microsoft solution, we're here to provide expert advice whenever you need it.
Call us at (800) 796-4854 or complete the form below and we'll help in any way we can.